Introduction
In the ever-changing landscape of cloud computing, observability continues to evolve.
In 2026, metrics, insights, and modern monitoring architecture are firmly back in focus. Organisations are under pressure to build high-performing Azure environments — while keeping operational costs predictable and under control.
For years, VM Insights has been the default approach for monitoring Azure Virtual Machines. It works, however it was designed in a different era of Azure.
Today, with Azure Monitor Workspaces and OpenTelemetry-based metrics, we have an opportunity to rethink how VM telemetry is collected, stored, and queried.
Migrating from VM Insights to OpenTelemetry metrics isn’t just a technical upgrade.
It’s a structural shift.
It enables:
- A metrics-first observability model
- Reduced log ingestion volumes
- More predictable cost behaviour
- Improved query performance
- Alignment with modern cloud-native standards
And in larger estates, that shift can translate into measurable cost savings.
This post explores what that migration looks like, why it matters architecturally, and how you can implement it using Infrastructure as Code.
Metrics Comparison
Before comparing, it’s important to clarify what we’re actually comparing.
- VM Insights collects guest performance data and sends it primarily to Log Analytics.
- OpenTelemetry-based metrics send dimensional metric data to Azure Monitor Workspace (metrics store).
They may look similar in dashboards — but under the hood, they are fundamentally different.
Data Collection Model
VM Insights
- Uses Azure Monitor Agent (previously MMA)
- Collects:
- Performance counters
- Dependency mapping data
- Guest OS telemetry
- Sends primarily to:
- Log Analytics Workspace
- Follows a log-centric ingestion model
Mental model:
Collect everything. Query it later.
OpenTelemetry Metrics (Azure Monitor Workspace)
- Uses Azure Monitor Agent
- Uses Data Collection Rules (DCR)
- Sends to:
- Azure Monitor Workspace (metrics pipeline)
- Follows OTEL semantic conventions
- Designed around a metrics-first model
Mental model:
Collect intentionally structured metrics.
Data Storage & Query Behaviour
| Area | VM Insights | OpenTelemetry Metrics |
|---|---|---|
| Storage backend | Log Analytics | Azure Monitor Metrics store |
| Query language | KQL | Metrics API / PromQL (Grafana) |
| Retention model | Log retention pricing | Metrics retention model |
| Performance | Depends on ingestion volume | Optimised for time-series |
| Cardinality handling | Log-driven | Dimensional metric model |
The key difference here is architectural:
VM Insights treats performance data as logs. OpenTelemetry treats it as time-series metrics.
That distinction matters for both performance and cost.
Enough Overviewing — Let’s Deploy
Everyone loves a demo and some pre-created Infrastructure as Code.
You can checkout the GitHub Repository here: https://github.com/smoonlee/azure-spring-clean-2026
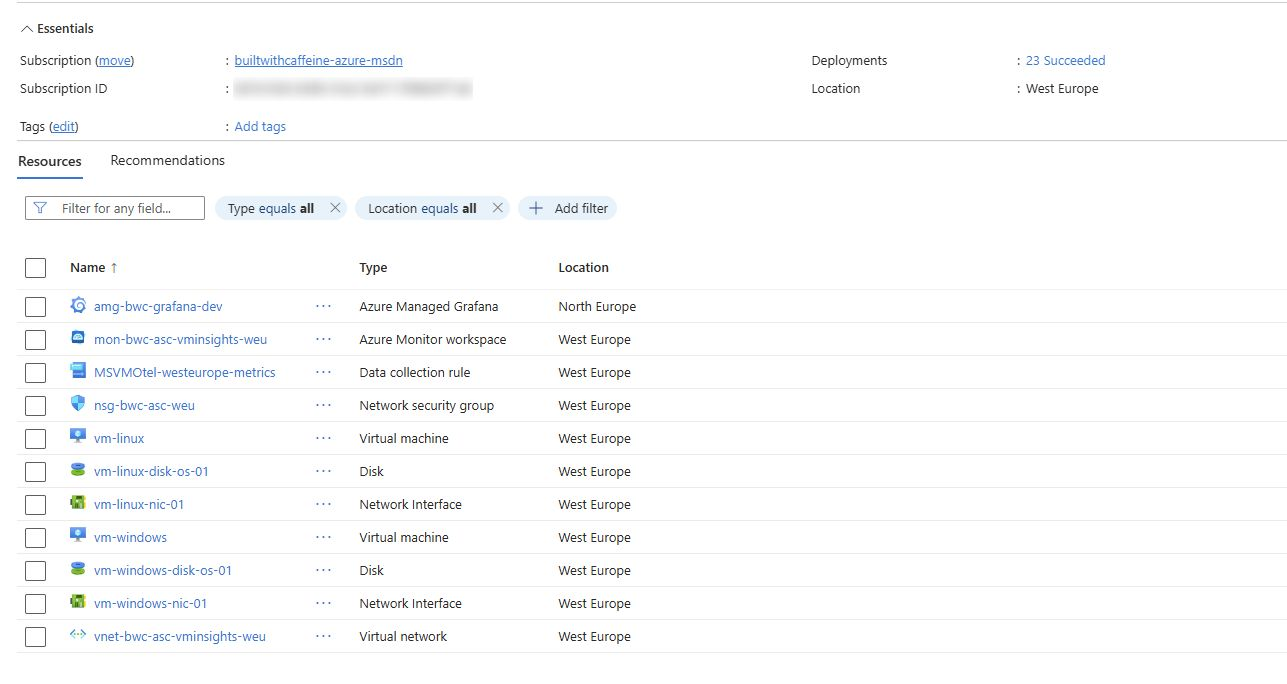
What do you get with the Bicep deployment? Great question! The deployment will create several resources.
- Resource Group
- Network Security Group
- Virtual Network
- 2x Virtual Machines (Windows & Linux)
- Azure Monitor Workspace
- Data Collection Rule for OTEL
- Azure Managed Grafana
To test out the demo all you need to do is the following
Clone GitHub Repository
| |
Change Directory, Infra Folder
| |
Don’t forget to configure the Bicep Param file!
| |
Execute Bicep Deployment
| |
Deployment takes around 5 minutes, so time to make a coffee and come back!
What Azure Doesn’t Tell You Upfront
This is where things get interesting. Deploying OpenTelemetry-based metrics isn’t complicated, but there are a few non-obvious behaviours worth calling out.
Hidden RBAC Requirements
During initial testing, I deployed a VM, connected it to OTEL, and immediately hit this:
RBAC PROBLEM
Access Denied: You do not have the necessary permissions to view the data in this section.
Please contact your administrator to request access.
After some digging (and comparing the portal JSON export), I found the cause:
The Virtual Machine requires a System Assigned Managed Identity in order to send telemetry to the Azure Monitor Workspace.
From a Bicep perspective:
| |
Without this, telemetry silently fails at the RBAC layer.
It’s not immediately obvious from the portal experience, and the error message doesn’t clearly point to managed identity configuration — but it’s critical for OTEL metrics to function correctly.
Metrics Delay
Another thing worth calling out — metrics do not appear instantly.
After deploying the Azure Monitor Agent, Data Collection Rule, and association, you may check the Azure Monitor Workspace straight away… and see nothing. This is expected.
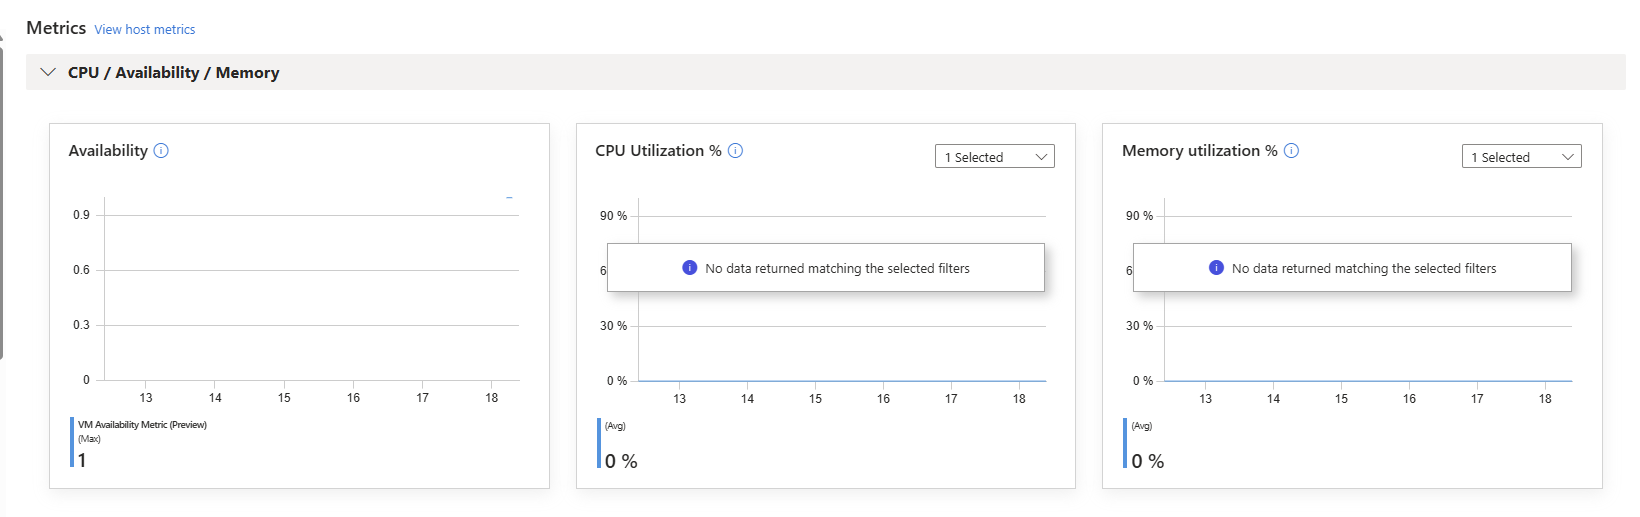
There’s an initial delay while:
- The agent configuration is applied
- The DCR is evaluated
- The metrics pipeline initialises
- The first sampling interval completes
So if you deploy and immediately panic because nothing is showing — don’t.
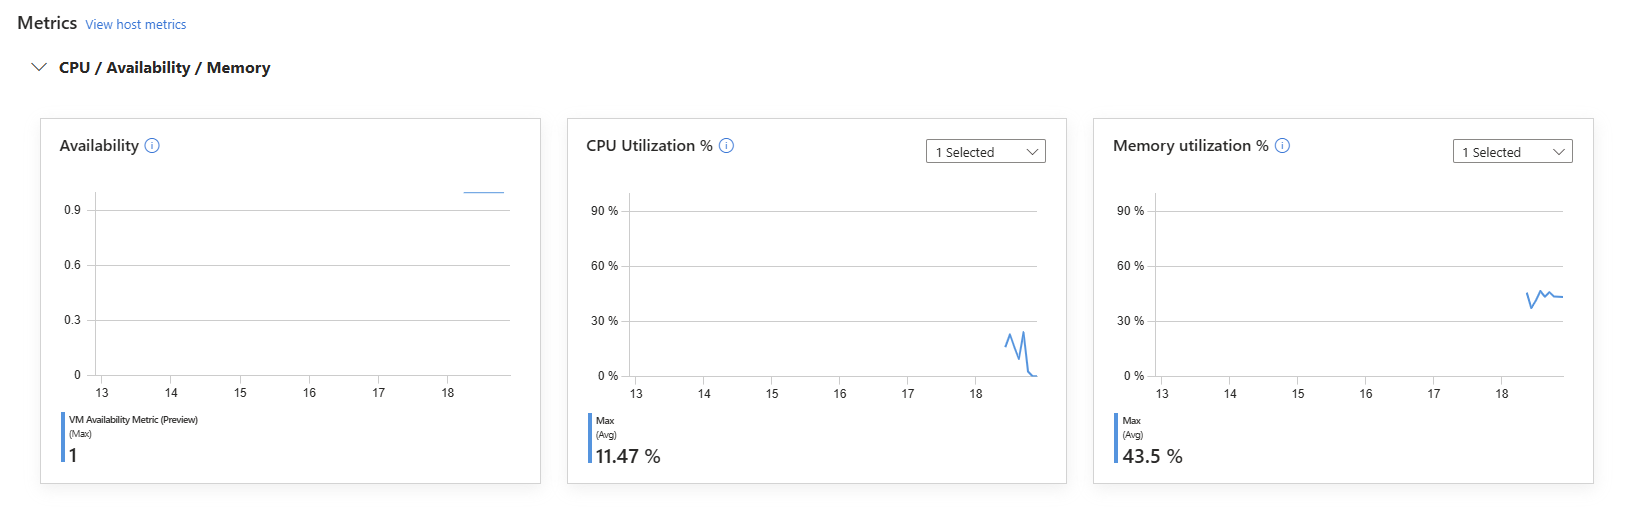
Have another coffee
, Come back in 25 minutes, They’ll be there.
Visual Metrics with Grafana
Deploying OpenTelemetry metrics is only half the story.
Observability becomes powerful when the data is easy to consume.
As part of the Bicep deployment, an Azure Managed Grafana instance is provisioned and connected to the Azure Monitor Workspace. This allows you to:
- Query metrics directly from the Azure Monitor metrics store
- Use PromQL-style queries
- Build time-series dashboards
- Create alert rules
- Standardise monitoring across environments
Unlike VM Insights workbooks, Grafana gives you:
- Cleaner separation between logs and metrics
- Native time-series visualisation
- Cross-resource dashboards
- Platform-wide consistency
Once deployed, you can:
- Open Azure Managed Grafana
- Add Azure Monitor as a data source (if not already configured)
- Select your Azure Monitor Workspace
- Begin building dashboards using the collected VM metrics
Because the metrics follow a dimensional model, you can slice by:
- Resource Group
- VM name
- Region
- Environment
- Custom tags
This is where the architectural shift becomes visible.
Instead of querying performance counters from logs, you’re interacting with structured time-series data.
Practical Example
While building out this project, I attempted to build some form of “example” dashboard to show what could be possible.
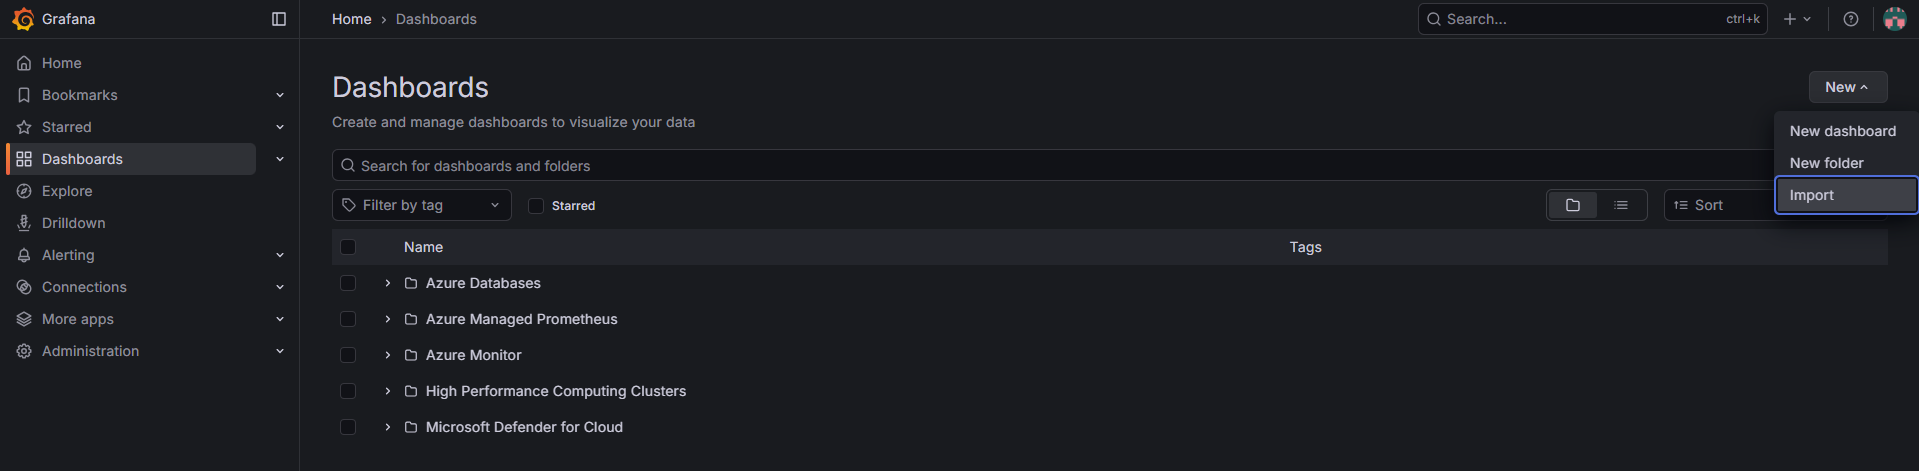
The example file virtual-machine-uptime.dashboard.json can be located under the GitHub Repository under the Grafana folder.
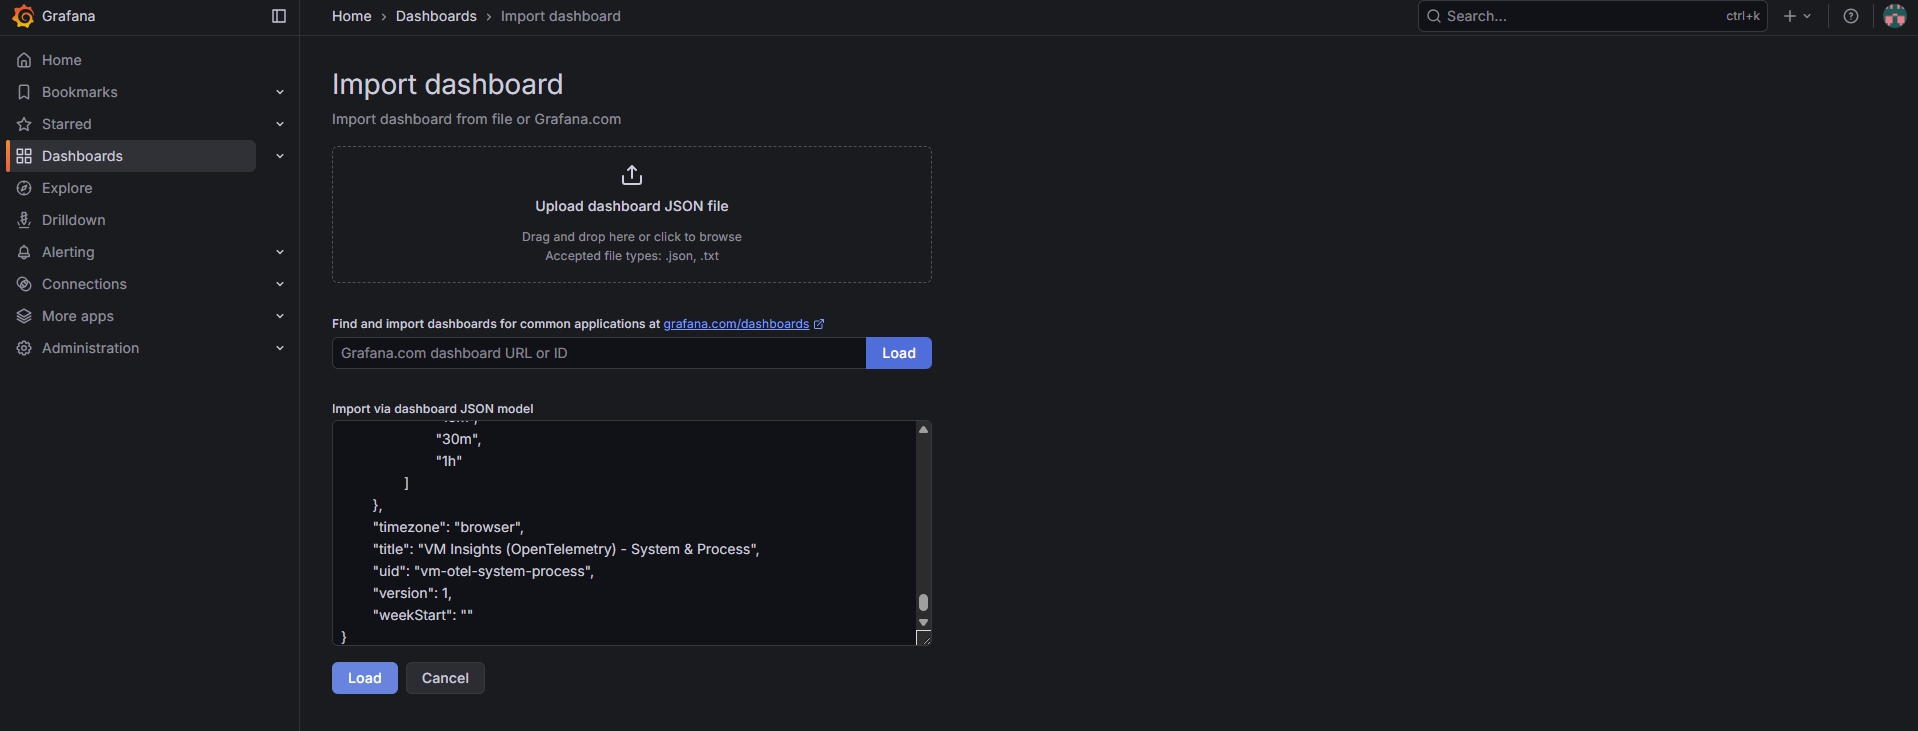
To deploy the example json, From the Grafana portal, Dashboard, New, Import
With Azure Managed Grafana provisioned, we can now import a dashboard designed specifically for OpenTelemetry-based VM metrics. This ensures we’re visualising time-series data — not querying logs.
Paste the contents of virtual-machine-uptime.dashboard.json into the import window and click Load.
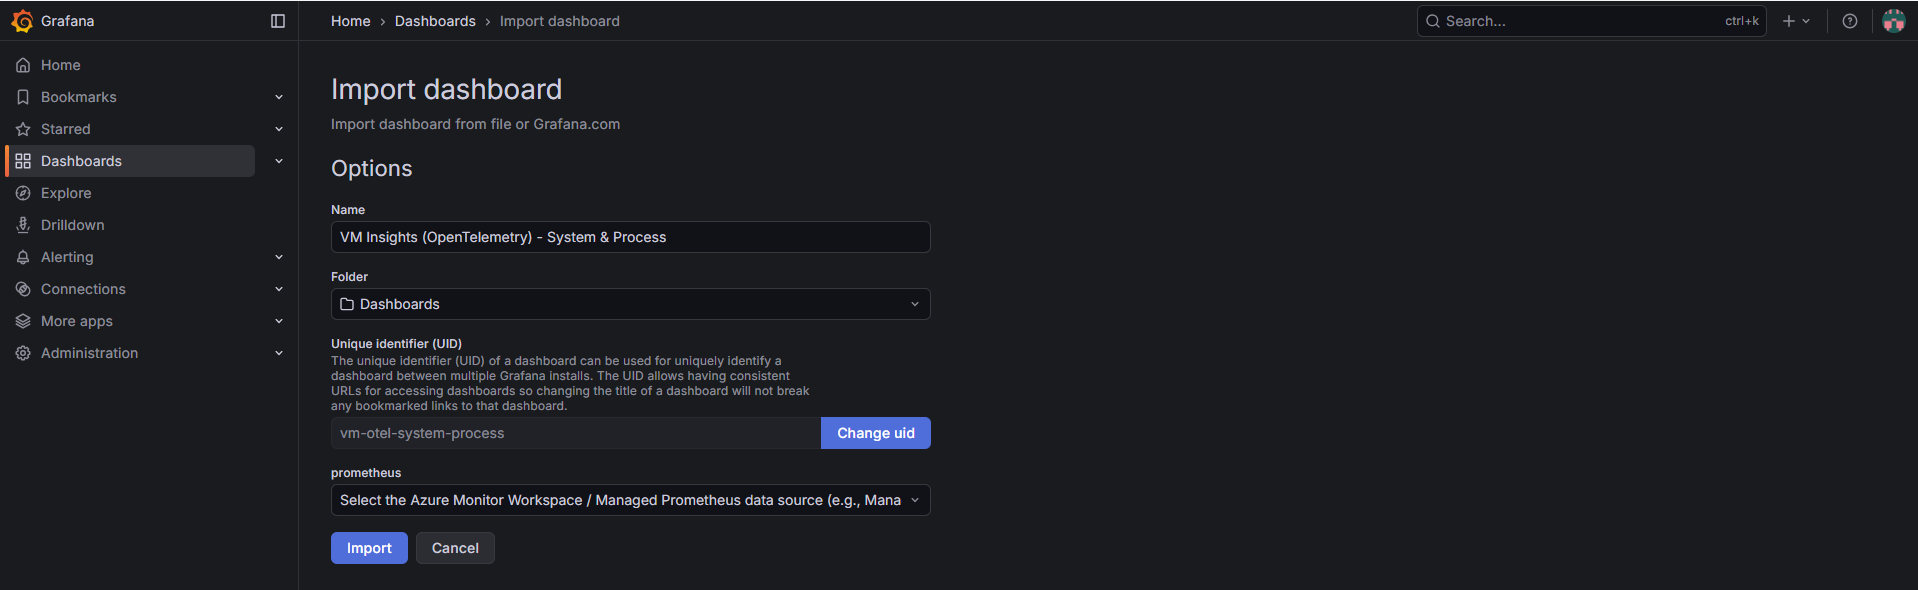
Select the Azure Monitor Workspace / Managed Prometheus data source and click Import to finalise the dashboard configuration.
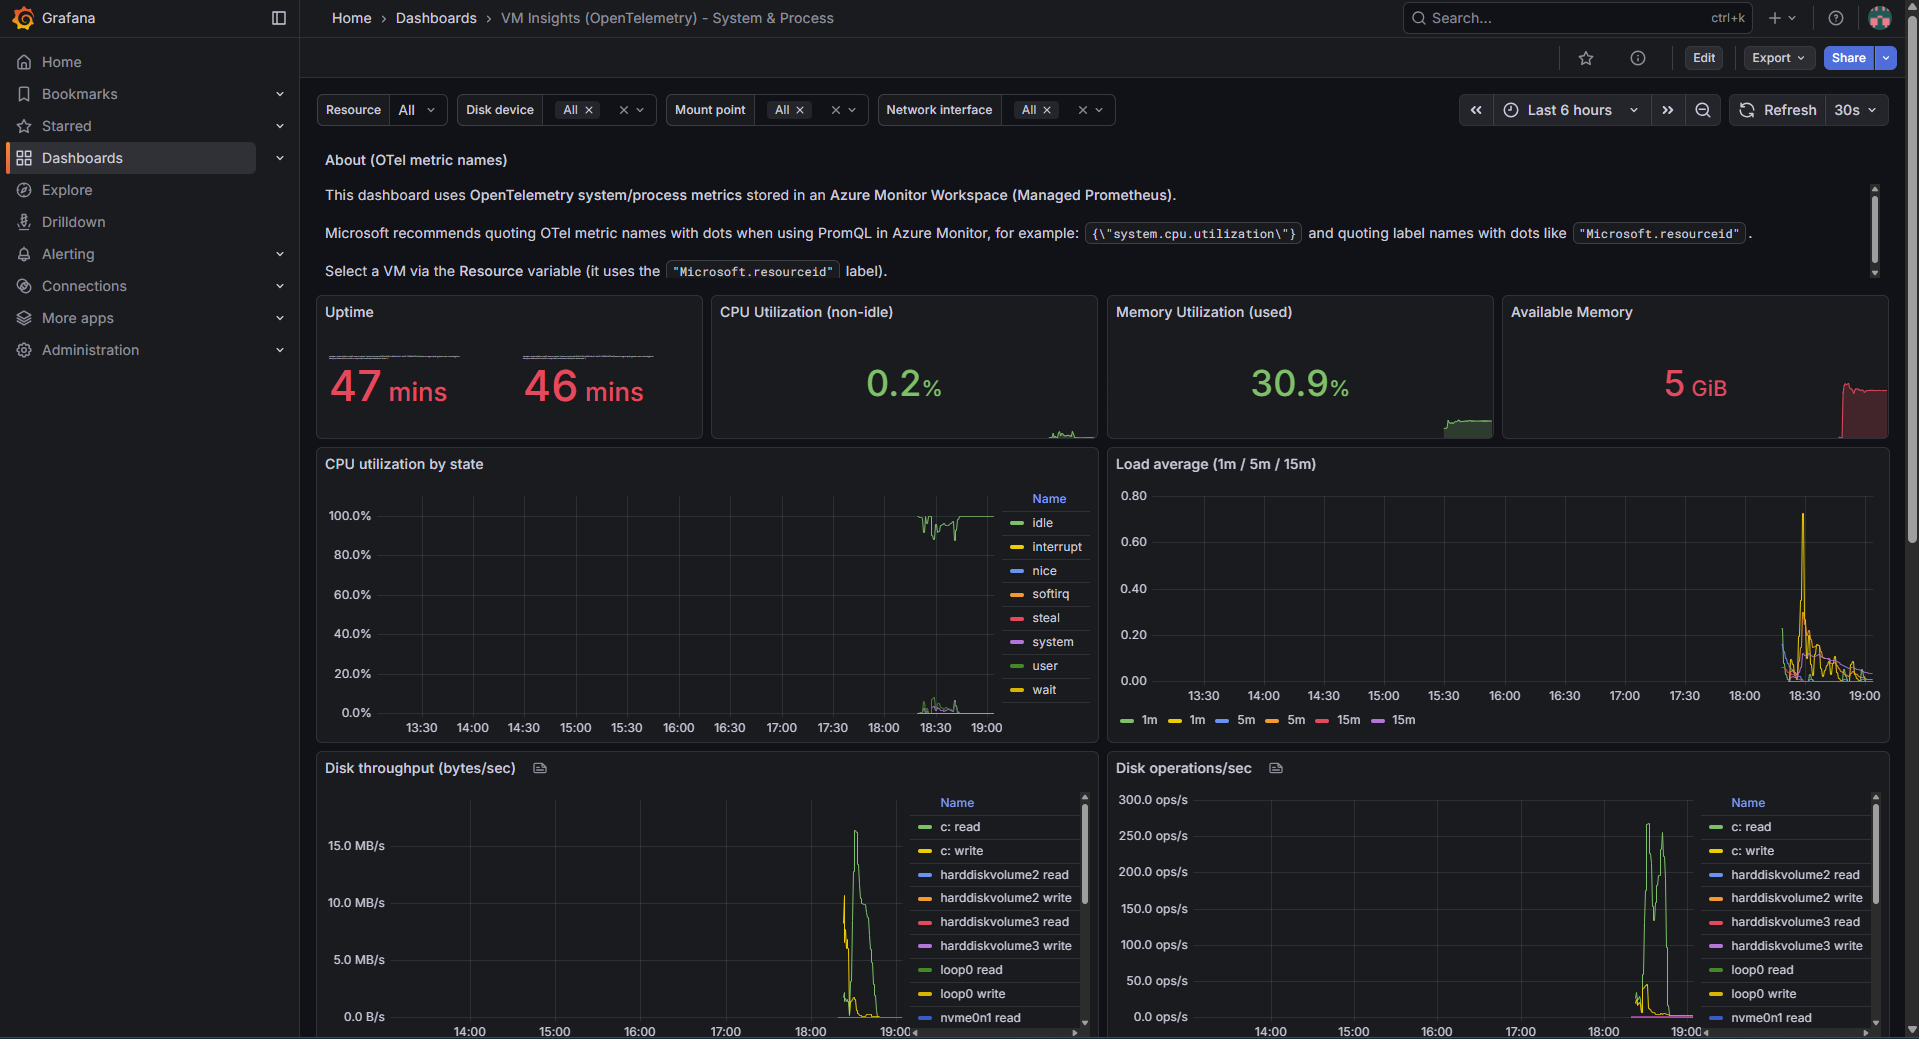
Import completed, the dashboard is now querying live OpenTelemetry metrics from Azure Monitor Workspace.
Summary
OpenTelemetry-based metrics, backed by Azure Monitor Workspace, represent a structural evolution in how Azure expects telemetry to flow.
This shift moves VM monitoring:
- From log-heavy ingestion
- To metrics-first architecture
- From reactive troubleshooting
- To structured observability
It improves:
- Query performance
- Cost predictability
- Alerting clarity
- Dashboard consistency
- Infrastructure-as-Code alignment
For smaller environments, the difference may feel incremental.
For larger estates, the operational and financial impact becomes significant.
Azure Spring Clean is about modernising what already exists.
Migrating from VM Insights to OpenTelemetry metrics is exactly that.
It’s not about chasing trends. It’s about building a monitoring platform that scales — technically and financially.